Main Tools
Carto; Tableau
Published
Online
Publisher
The Bristol Cable
Brexit Bristol
I worked with Dean Ayotte on two articles to visualise the referendum data in Bristol.
In the first, I helped create a chloropleth map representing votes for and against Brexit per ward.
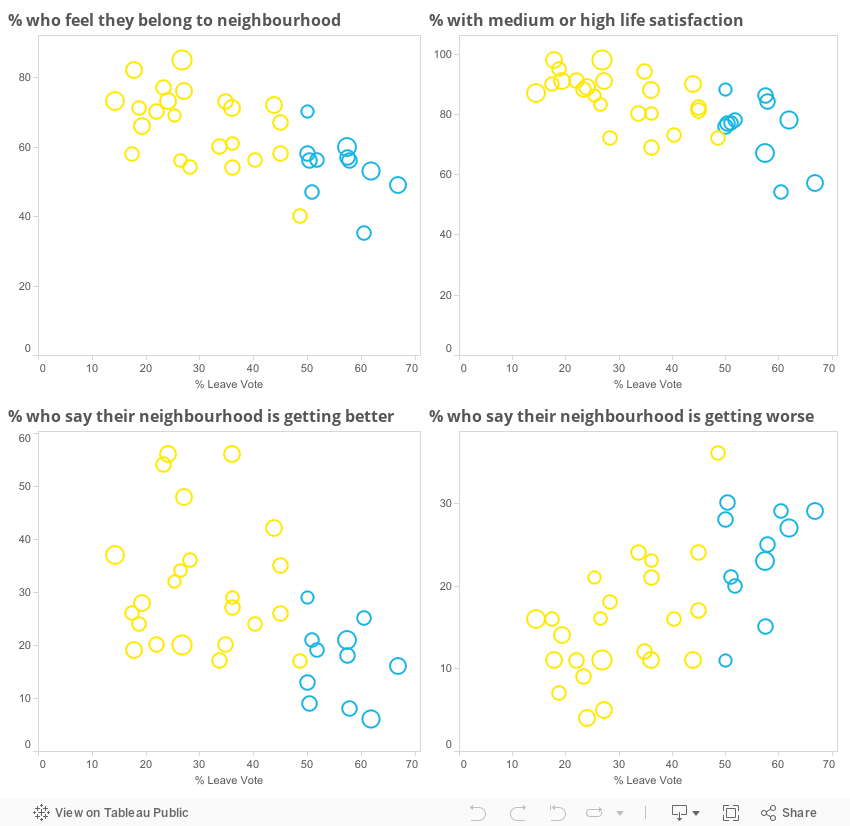
For the second piece we looked see how various measures correlated with how wards voted in the referendum. Inspired by the Guardian, but lacking the abilitiy to recreate the charts with D3.js, we used Tableau to create scatterplot charts, which confidently showed trends.